
EducationHow a lab checks a vial
HPLC Explained: How Labs Measure Peptide Purity

Written by Julia Piccoli, PhD
Associate R&D Director, Kemin Industries LATAM · Published · 6 min read
High-performance liquid chromatography, or HPLC, estimates peptide purity by separating sample components and measuring their detector responses. The main peak’s integrated area is compared with the total area of the peaks included in the method. The result is chromatographic area purity. It does not independently establish identity or measure how much of the powder’s weight is peptide.
In this article+−
- What does HPLC actually do?
- Why do different molecules come out at different times?
- How does the detector see a peptide?
- How is HPLC purity calculated?
- What does the method line on a certificate mean?
- What can a method change reveal?
- How is the reporting wavelength chosen?
- How do I check that the main peak is really one compound?
- What can't HPLC tell you?
- Frequently asked questions
- Sources
What does HPLC actually do?
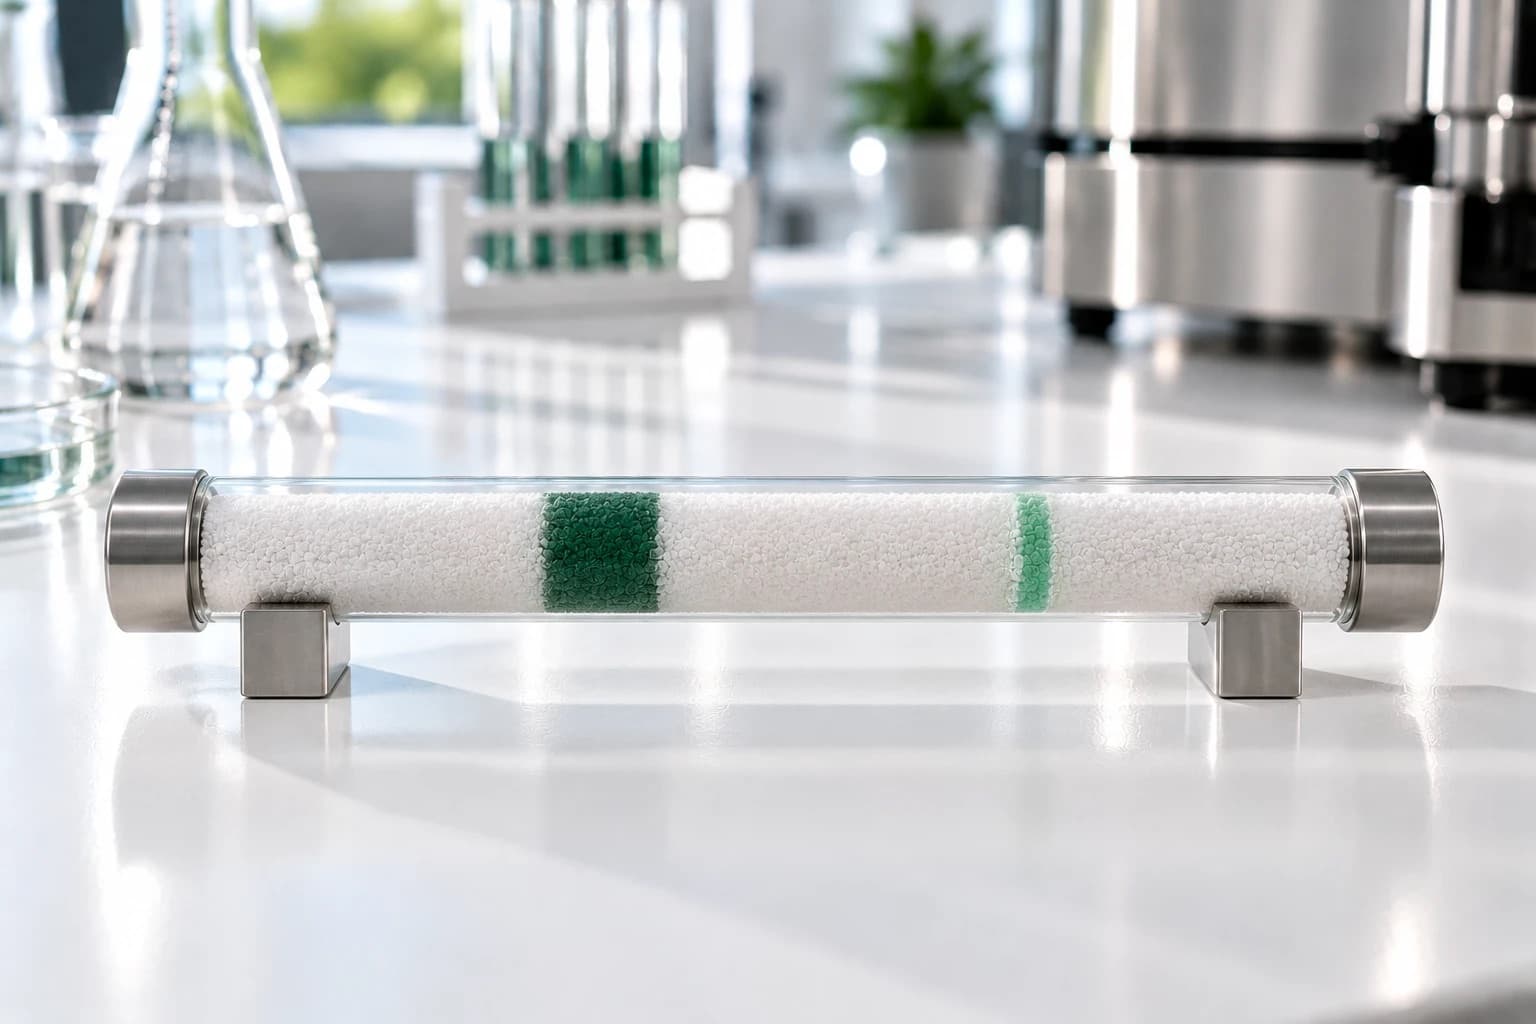
A pump pushes a liquid, the mobile phase, at high pressure through a narrow steel column packed with very fine particles, the stationary phase. A small amount of sample is injected into the flowing liquid. As the sample travels, its different molecules interact with the packing to different degrees, so they spread out into separate bands. A detector at the far end records each band as it passes.
The "high performance" comes from those fine particles and the pressure needed to push liquid through them: smaller particles separate more sharply. The pharmacopeias' chromatography chapter (USP <621> in the US) calls the technique pressurized liquid chromatography, noting that it's commonly called high pressure or high-performance liquid chromatography. The result, plotted against time, is a chromatogram.
Swipe sideways to see the whole trace.
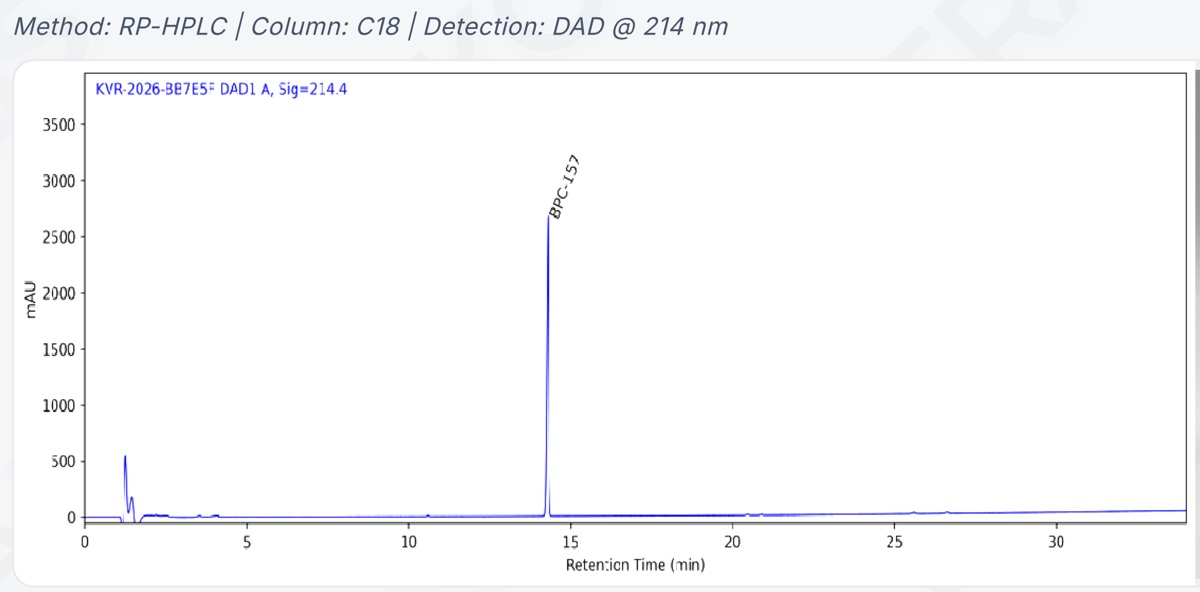
- The main peak, labeled BPC-157. Its share of the included peak area is the purity figure: 99.621% on this certificate.
- Its retention time: where the peak sits on the time axis, just after 14 minutes on this run.
Open the full certificate (PDF)
Why do different molecules come out at different times?
Peptides are usually analyzed by reversed-phase HPLC. Its packing carries hydrophobic chains, while the mobile phase is mostly water. Molecules interact with the packing to different degrees and elute in order of increasing overall hydrophobicity. “C18” refers to 18-carbon chains bonded to silica and is a common peptide packing. Mant and colleagues' methods review describes C8 and C18 silica packings as the favored choices for peptides, which come off in order of increasing overall hydrophobicity.
During the run, the lab gradually increases an organic solvent, usually acetonitrile. This gradient releases molecules from the packing in sequence. An acid such as trifluoroacetic acid is added around 0.05% to 0.1% to improve peak shape.
Think of it as a race in which each runner stops at the trackside cafés a different number of times. The comparison breaks down at the finish: there's no winner, and the order depends on the conditions, so a different column or gradient can reshuffle it.
How does the detector see a peptide?
Most peptide methods use ultraviolet detection. Peptide bonds absorb strongly below about 220 nm; 214 nm is widely used. A diode array detector (DAD) records spectra over time, allowing the lab to select a reporting wavelength and assess spectral uniformity.
As each band passes, absorbance rises and falls to form a peak. Its position is the retention time.
How is HPLC purity calculated?
The usual figure is an area percent. Software measures the area under each peak:
Purity (%) = main peak area ÷ total included peak area × 100
A main peak holding 99.6% of the total area gives a purity of 99.6%. The pharmacopeias' harmonized chromatography text describes exactly this normalization, and it leaves out peaks that come from solvents or the mobile phase, injection disturbances and peaks known not to originate from the sample, along with any below a set reporting threshold.
That calculation carries an assumption: that everything counted responds about equally at the chosen wavelength. For close relatives of the main peptide that's usually reasonable, but it isn't exact. Some side chains absorb far more strongly at 214 nm than a peptide bond does (tryptophan about 30 times as much, by Kuipers and Gruppen's measurements), and pharmacopeia methods apply correction factors when a response differs by more than about 20%.
It also means purity is a share of the signal, not a share of the weight. what a purity figure does and doesn't count explains why that distinction matters.
What does the method line on a certificate mean?
The certificate of analysis library includes a certificate for a batch of BPC-157 with the line: “Method: RP-HPLC | Column: C18 | Detection: DAD @ 214 nm.”
This identifies reversed-phase HPLC, a C18 column and diode-array detection reported at 214 nm. The certificate reports 99.621% purity against a specification of >98%, meaning the main peak accounted for 99.621% of the included integrated area under that method. how to read a certificate of analysis explains the rest of the document.
BPC-157 on this siteBPC-157 ReferenceBPC-157 ResearchRegeneration Peptides
What can a method change reveal?
As an illustrative example, the first method may report a very high purity result because a closely related impurity co-elutes with the main peptide peak. Switching to a column with different selectivity or using a thinner gradient can separate that hidden component, reducing the reported main-peak area. A different wavelength may also reveal an impurity that responded weakly at the original setting. In that case, the first method did not detect a new impurity—it failed to resolve or adequately represent one that was already present.
How is the reporting wavelength chosen?
The wavelength should be selected during method development to provide adequate sensitivity for the target peptide and relevant impurities, acceptable baseline behavior and suitable detector response. Around 214 nm is useful because peptide bonds absorb strongly, but area percent is not automatically equal to molar or weight percent. Aromatic residues—especially tryptophan, tyrosine and phenylalanine—can increase absorbance, so an impurity enriched in these residues may appear disproportionately large, while a component with fewer aromatic residues may appear smaller than its actual amount.
How do I check that the main peak is really one compound?
A clean-looking chromatographic peak is a good sign, but it does not prove that only one compound is present. Start by checking the peak shape and, when available, the DAD peak-purity or spectral-uniformity results. Next, use LC-MS to confirm that the peak has the expected mass. If there is still doubt—especially if you see a shoulder, an unusual spectrum or a change after modifying the method—an impurity may be co-eluting with the main peptide. In that case, analyze the sample using a second chromatographic method that separates compounds differently. When the peak shape, DAD assessment, LC-MS result and second method all agree, you can be more confident that the main peak represents a single compound.
What can't HPLC tell you?
It cannot establish identity from retention time alone. A peak at the expected time is consistent with the target peptide, but different molecules can arrive together. Identity therefore needs complementary evidence, usually LC-MS.
HPLC also misses or excludes some material. Water and counter-ions add powder weight but are not represented like resolved peptide impurities; solvent, mobile-phase and sub-threshold peaks may be excluded.
It also cannot separate what the method does not resolve. An impurity that travels with the peptide can hide within the main peak, which is why a second method with different selectivity may reveal what the first missed.
Frequently Asked Questions
What does RP-HPLC mean on a certificate?+−
RP stands for reversed phase. The column's packing is oil-friendly and the liquid flowing through it starts mostly water, the reverse of "normal phase" methods, which pair a water-friendly packing with an oily liquid. Reversed phase is the standard approach for peptides because it separates closely related sequences well.
Can HPLC identify a peptide?+−
Not on its own. ICH's guideline on specifications says identification by a single retention time isn't regarded as specific: matching a known reference sample is supporting evidence, but different molecules can share a retention time. That's why certificates usually pair an HPLC purity result with a mass-based identity test, such as LC-MS, which checks that the main component has the expected mass.
Is 99% HPLC purity the same as 99% peptide by weight?+−
The most common misunderstanding is treating area purity as composition by weight. A result of 99% means that the main peak accounts for approximately 99% of the included detector area under that method. It does not mean that 99% of the lyophilized powder’s weight is necessarily the target peptide.
Can two laboratories report different purity results for the same sample?+−
Yes. Differences in columns, gradients, mobile-phase additives, temperature, detector wavelength, integration and reporting thresholds can change separation and the calculated result. A difference does not automatically mean that one laboratory is wrong; compare the analytical conditions first.
Sources
- Mant CT, Chen Y, Yan Z, et al. HPLC analysis and purification of peptides. Methods in Molecular Biology 2007;386:3-55. doi.org/10.1007/978-1-59745-430-8_1
- Pharmacopoeial Discussion Group, harmonized general chapter G-20 Chromatography (USP <621>, Ph. Eur. 2.2.46, JP 2.00), signed off September 2021; free copy from Japan's PMDA. pmda.go.jp/files/000244598.pdf
- Japanese Pharmacopoeia, chromatography general chapter 2.00, English text. pmda.go.jp/files/000242735.pdf
- Kuipers BJH, Gruppen H. Prediction of Molar Extinction Coefficients of Proteins and Peptides Using UV Absorption of the Constituent Amino Acids at 214 nm. Journal of Agricultural and Food Chemistry. 2007;55(14):5445-5451. doi.org/10.1021/jf070337l
- Tuzimski T, Petruczynik A. Review of chromatographic methods coupled with modern detection techniques. Molecules 2020;25(17):4026. doi.org/10.3390/molecules25174026
- ICH Q6A, Specifications: Test Procedures and Acceptance Criteria for New Drug Substances and New Drug Products: Chemical Substances (1999), section 3.2.1. database.ich.org/sites/default/files/Q6A%20Guideline.pdf
- Kovera Labs. Certificate of Analysis, report KVR-2026-BB7E5F, BPC-157, batch PP/BPC/062026. purepeptides.com/coa/bpc-157-pp-bpc-062026.pdf
Worked example
The article borrows BPC-157 from the catalogue to show the idea on a real molecule.
Shop lot-tested BPC-157
View Product · BPC-157The document in this article
BPC-157 certificate of analysisKovera Labs report KVR-2026-BB7E5F, batch PP/BPC/062026
Open the PDF
About the author
Julia Piccoli, PhD
Associate R&D Director, Kemin Industries LATAM · PhD in Biotechnology
Dr. Julia Piccoli is the Associate R&D Director for Latin America at Kemin Industries in Brazil, where she leads innovation and technical strategy initiatives across the animal nutrition market. She holds a bachelor's degree in chemistry and earned both her M.Sc. and Ph.D. in Biotechnology. With more than 14 years of experience in academia and industry, her work has focused on peptides, biotechnology, food preservation, enzymes, and applied innovation for both pharmaceutical and animal nutrition. Julia collaborates closely with commercial, regulatory, and technical teams to translate scientific research into practical solutions that create value for customers and the industry.
Disclosure: Employed by Kemin do Brasil. The opinions expressed are her own and do not necessarily reflect those of her employer. No conflicts of interest related to the information presented are declared.
The author checked the claims in this article against its sources and approved the text as published on .