
EducationHow a lab checks a vial
How to Read a Chromatogram

Written by Julia Piccoli, PhD
Associate R&D Director, Kemin Industries LATAM · Published · 6 min read
A chromatogram is a timeline of what the detector sees after a sample is injected. The horizontal axis shows time, while the vertical axis shows the strength of the detector’s response. Each peak appears when a group of molecules reaches the detector. Purity is estimated from the area under each peak, not simply its height.

In this article+−
What do the two axes show?
The horizontal axis shows how long each component takes to reach the detector after injection. Components that interact more strongly with the column usually appear later. Retention time can support a comparison with a reference analyzed under the same conditions, but it does not prove identity: different compounds can elute at the same time, and method changes can shift a peak.
The vertical axis shows detector response. In peptide methods using ultraviolet detection, it reflects absorbance at the selected wavelength. Together, the two axes show detector response over time.
RelatedHow HPLC separates molecules
What are the baseline and the peaks?
The baseline is the detector signal recorded when no distinct sample component is passing through the detector. An ideal baseline would be flat and stable, but real chromatograms contain some noise and may also show drift. Noise is a rapid fluctuation in the signal. It can affect how confidently a very small peak is distinguished from the baseline. Drift is a gradual movement of the baseline upward or downward during the run. In gradient HPLC, baseline drift may occur because the mobile-phase composition changes over time. The solvents and additives used in the method can contribute differently to ultraviolet absorbance as their proportions change.
For example, a chromatogram may appear highly impure, with peaks throughout the trace. Troubleshooting may reveal that the problem lies in the chromatographic system rather than in the peptide. Before concluding that a sample is impure, the laboratory should confirm whether the signal originates from the sample or the instrument.
A peak is the rise and fall in detector response as a band of material passes through the detector. Its retention time is normally assigned at the maximum response. Peak width also matters. A narrow peak occupies a smaller time interval than a broad peak. When two components have similar retention times, narrower peaks can make them easier to distinguish. Broadening increases the overlap between close components and can make a minor impurity more difficult to resolve.
Peak shape should therefore be evaluated together with retention time and area. A large peak is not automatically a well-resolved or analytically specific peak.
Why does purity use peak area, not height?
Because area captures the detector response across the whole peak. Height measures only the highest point. A short, broad peak can therefore represent as much material as a tall, narrow one. Pharmacopeial methods may use either measure for specific purposes, but the purity percentage is based on peak area.
Same area, different heights
On a peptide certificate, purity is usually reported as area percent: divide the main peak area by the total area of all peaks included in the calculation, then multiply by 100. The harmonized pharmacopeial chapter excludes peaks from solvents and the mobile phase, as well as peaks below the reporting threshold, generally 0.05%. One limitation is that the calculation assumes the included compounds respond similarly at the selected wavelength. This is only approximate: Kuipers and Gruppen found that tryptophan absorbs about 30 times more strongly than a peptide bond at 214 nm.
Integration is the step in which the software decides where a peak begins and ends and where the baseline runs beneath it. The analyst defines the settings, so changing them can change the calculated areas, and therefore the reported purity. FDA data-integrity guidance notes that changing the baseline and reprocessing data can make peaks appear smaller or larger. In a worked example by Blanc and colleagues, an impurity with a true value of 0.100% was reported between 0.028% and 0.104%, depending on how it was separated from the main peak. In practice, it’s essential to establish the integration rules during method development and then apply them consistently. The reported purity can change when integration settings are modified, especially around shoulders and partially resolved peaks.
What do side peaks, shoulders and early bumps mean?
A side peak is a separate detector response appearing before or after the main peak. In a synthetic peptide sample, side peaks may represent peptide-related impurities, degradation products, process-related components, or another substance that responds at the selected wavelength. The chromatogram alone normally cannot establish which explanation is correct.
A shoulder is a distortion on the side of a larger peak. It may indicate a second component that is only partially separated from the main component, although column problems, sample-solvent effects, excessive loading, and other chromatographic conditions can also alter peak shape. If an impurity co-elutes with the target peptide, both responses may appear within one peak. Improving chromatographic resolution may separate the hidden component, while an orthogonal method such as mass spectrometry can help confirm its identity.
Early spikes or dips may arise from the injection, sample solvent, or material that is not retained by the column. These signals occur around the system’s hold-up time. Depending on the method, solvent and mobile-phase disturbances may be excluded from purity calculations.
The practical point is that peak position alone does not explain peak origin. The method, blank, sample preparation, system suitability, peak shape, and any orthogonal data all contribute to the interpretation.
RelatedWhat makes up the rest of a purity figure
What does the trace on a real certificate show?
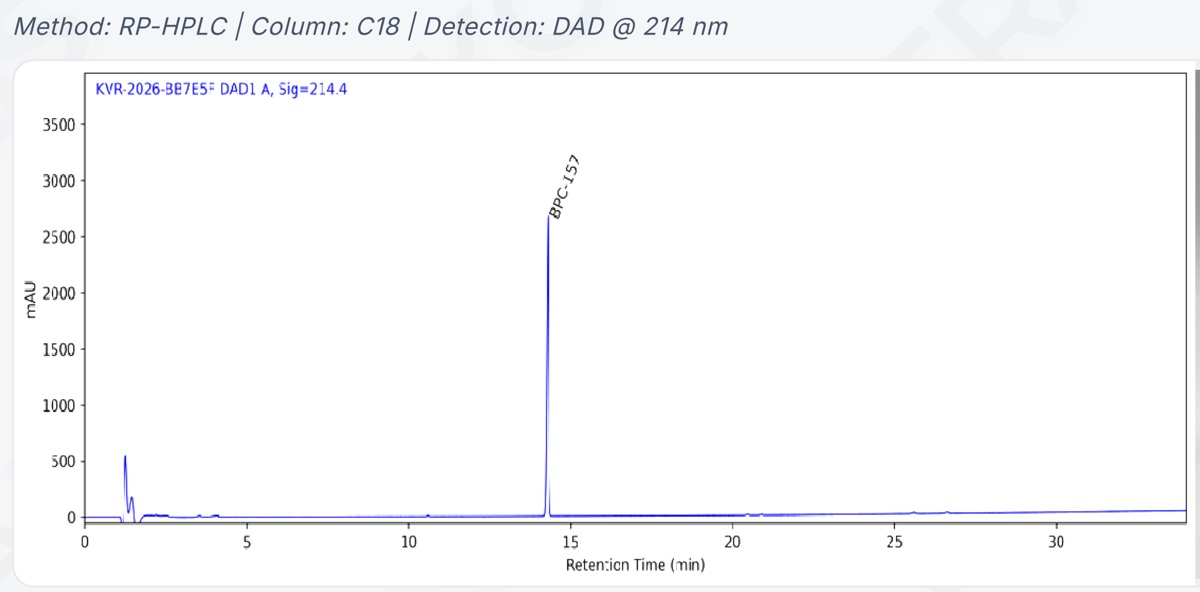
The certificate of analysis library includes one for a batch of BPC-157, and it prints its chromatogram with the method line "Method: RP-HPLC | Column: C18 | Detection: DAD @ 214 nm".
The readings below are taken by eye from the printed axes, so they're approximate. The vertical axis is labeled mAU and runs from 0 to 3,500. The horizontal axis is labeled Retention Time (min) and runs from 0 to a little past 30. In the first two minutes, the trace dips, spikes to roughly 550 mAU, shows a smaller second spike and dips again. Then it settles. A single tall, narrow peak labeled BPC-157 rises just past 14 minutes to about 2,700 mAU. A few blips, too small to measure by eye, sit near 4, 10, 20 and 26 minutes, and after the main peak the baseline creeps gently upward to the end of the run.
Swipe sideways to see the whole trace.
- The vertical axis: mAU, from 0 to 3,500.
- The horizontal axis: retention time in minutes, from 0 to a little past 30.
- The first two minutes: a dip, a spike to roughly 550 mAU, a smaller second spike and another dip.
- One tall, narrow peak labeled BPC-157, just past 14 minutes, at about 2,700 mAU.
- Blips too small to measure by eye, near 4, 10, 20 and 26 minutes (the arrowheads).
- After the main peak, the baseline creeps gently upward to the end of the run.
What the printout doesn't include is a peak table: no retention-time figures and no areas. You can see the shape behind the certificate's purity result of 99.621%, but you can't recompute that number from the picture. how to read a certificate of analysis walks through the rest of the document.
BPC-157 on this siteBPC-157 ReferenceBPC-157 ResearchRegeneration Peptides
What can't a chromatogram tell you?
A chromatogram does not establish identity on its own. A peak at the expected retention time shows that a detected component reached the detector at that point under that method. It does not prove that the component has the expected molecular mass or sequence. Identity requires additional evidence, commonly including mass spectrometry.
A chromatogram also cannot show a component that the detector does not adequately detect. Detector response depends on the wavelength and chemical structure. A component with little response under the selected conditions may be underrepresented.
Finally, a chromatogram does not measure net peptide content. Water, counter-ions, residual solvents, and other contributions to powder weight are not represented in the HPLC area percentage in the same way as resolved peptide-related impurities.
A chromatogram should therefore be interpreted together with the HPLC result, integration information, identity data, net peptide content, and method conditions. No single trace provides a complete assessment of a peptide sample.
Frequently Asked Questions
What does mAU mean on a chromatogram?+−
It stands for milli-absorbance units, thousandths of an absorbance unit. Absorbance measures how much light the liquid passing the detector absorbs at the chosen wavelength. Bigger numbers mean more light absorbed at that moment. It's a measure of detector response, not of weight, so mAU values can't be read directly as amounts.
Why is there a spike at the very start of a chromatogram?+−
It usually marks a system or injection-related disturbance rather than peptide content: the sample solvent, or material the column does not retain, reaching the detector around the system’s hold-up time. Its treatment in the purity calculation depends on the analytical method.
Can you work out purity from a printed chromatogram?+−
Not reliably. A printed chromatogram is a visual summary: without a peak table it shows no areas, and small peaks can be hard to see at the printed scale. The reported purity should be checked against the certificate’s numerical results and supporting analytical data.
Sources
- Pharmacopoeial Discussion Group, harmonized general chapter G-20 Chromatography (USP <621>, Ph. Eur. 2.2.46, JP 2.00), signed off September 2021; free copy from Japan's PMDA pmda.go.jp/files/000244598.pdf
- Japanese Pharmacopoeia, chromatography general chapter 2.00, English text pmda.go.jp/files/000242735.pdf
- Hesse A, Weller MG. Protein quantification by derivatization-free high-performance liquid chromatography of aromatic amino acids. Journal of Amino Acids 2016;2016:7374316 doi.org/10.1155/2016/7374316
- Kuipers BJH, Gruppen H. Prediction of molar extinction coefficients of proteins and peptides using UV absorption of the constituent amino acids at 214 nm. J Agric Food Chem 2007;55(14):5445-5451 doi.org/10.1021/jf070337l
- US FDA. Data Integrity and Compliance With Drug CGMP: Questions and Answers, Guidance for Industry (December 2018) fda.gov/media/119267/download
- Blanc T, Wätzig H, Sänger-van de Griend C. Peak integration of electropherograms in GMP and research labs. Electrophoresis 2025;46(11-12):653-668 doi.org/10.1002/elps.70002
- Redón L, Subirats X, Rosés M. Evaluation of hold-up volume determination methods and markers in hydrophilic interaction liquid chromatography. Molecules 2023;28(3):1372 doi.org/10.3390/molecules28031372
- Kovera Labs. Certificate of Analysis, report KVR-2026-BB7E5F, BPC-157, batch PP/BPC/062026 purepeptides.com/coa/bpc-157-pp-bpc-062026.pdf
Worked example
The article borrows BPC-157 from the catalogue to show the idea on a real molecule.
Shop lot-tested BPC-157
View Product · BPC-157The document in this article
BPC-157 certificate of analysisKovera Labs report KVR-2026-BB7E5F, batch PP/BPC/062026
Open the PDF
About the author
Julia Piccoli, PhD
Associate R&D Director, Kemin Industries LATAM · PhD in Biotechnology
Dr. Julia Piccoli is the Associate R&D Director for Latin America at Kemin Industries in Brazil, where she leads innovation and technical strategy initiatives across the animal nutrition market. She holds a bachelor's degree in chemistry and earned both her M.Sc. and Ph.D. in Biotechnology. With more than 14 years of experience in academia and industry, her work has focused on peptides, biotechnology, food preservation, enzymes, and applied innovation for both pharmaceutical and animal nutrition. Julia collaborates closely with commercial, regulatory, and technical teams to translate scientific research into practical solutions that create value for customers and the industry.
Disclosure: Employed by Kemin do Brasil. The opinions expressed are her own and do not necessarily reflect those of her employer. No conflicts of interest related to the information presented are declared.
The author checked the claims in this article against its sources and approved the text as published on .